
CSSBB Online Practice Questions and Answers
Questions 4
As a means of measuring the effects on other areas of a process as a result of changes in the primary metric we also define and track ________________.
A. Parallel process metrics
B. Secondary metrics
C. Tertiary metrics
D. Industry standards
Questions 5
Much of the Six Sigma methodology is used to identify and remove causes for _____________ .
A. Process Variation
B. Material Costs
C. Excess Inventory
D. Lost Sales
Questions 6
A(n) ______________ is best used to compare a Machine 1 average quality characteristic to the same quality characteristic of Machine 2.
A. F test
B. 1-Sample t-test
C. 2-Sample t-test
D. ANOVA test
Questions 7
Kanban establishes a means of monitoring production, conveyance and delivery information such that efficient flow is established. The method used by Kanban is to require a _________ before anything moves.
A. Sign-off
B. Signal
C. Bell to ring
D. Work order
Questions 8
With Measurement System Analysis we are concerned with two issues that impact the potential variability of the data. They are ____________ and Accuracy.
A. Spread
B. Reliability
C. Precision
D. Deflection
Questions 9
The _______ is the most frequently occurring value in a distribution of data.
A. Median
B. Mean
C. Mode
D. Center Point
Questions 10
A Belt is analyzing data and upon creation of the graphical analysis sees multiple modes. One of the primary reasons this could occur is because the process has experienced a ____________________.
A. Significant change from one shift to another
B. Sizable Measurement System error
C. Catastrophic failure of some sort D. Any one of these
Questions 11
Which of these graphs demonstrates conditions which would be sufficient to enable OCAP for the process?
A. Xbar Chart
B. Time Series Chart
C. Neither
D. Both
Questions 12
Which statements are correct about the advanced Capability Analysis shown here?
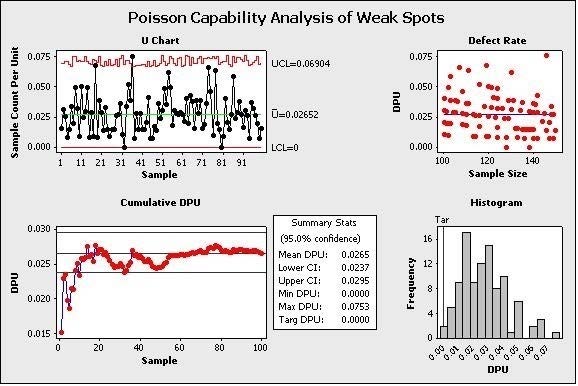
(Note: There are 3 correct answers).
A. This is a Poisson Capability Analysis.
B. The average DPU with 95% confidence is between 0.024 and 0.0295.
C. The DPU does not seem to vary depending on sample size.
D. The process shows only one instance of being out of control statistically so we have confidence in the estimated DPU of this process.
E. The maximum DPU in one observation was nearly 0.0753.
Questions 13
When a Belt conducts a Linear Correlation Analysis and finds that as an X increases the Y also increase then he has proven a ______________ correlation.
A. Negative
B. Positive
C. Monomial
D. Single alignment
![]()
![]()
Home | About Us | Contact Us | FAQ | Guarantee Policy | Privacy Policy
Any charges made through this site will appear as Global Simulators Limited. All trademarks are the property of their respective owners.
Copyright © 2004-2026 pass2lead.com, All Rights Reserved.