
C2090-621 Online Practice Questions and Answers
Questions 4
A report author has applied a Union set operation on two queries with the resultant query named Main_Query containing the data items: Product line, Order method/Region, Revenue and Unit Sale Price. The report author added the data items to the list, grouped on Product line and Order method/Region. The screenshot below shows the result:
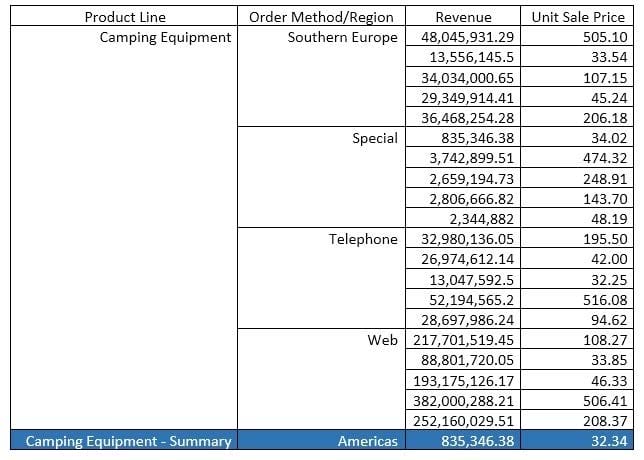
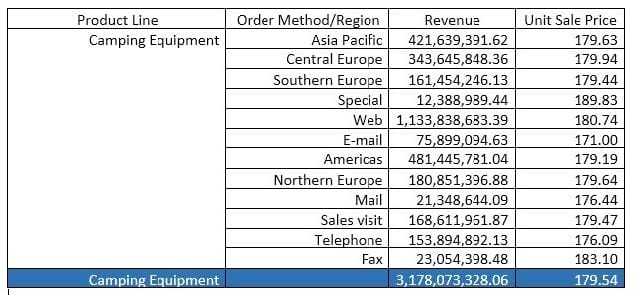
What must the report author do for the report to look like the following?
A. Set the detail aggregation property to Automatic for each field.
B. Set the detail aggregation property to None for product line and order method. Total for Revenue. Average for Unit Sale Price.
C. Set the detail aggregation property to None for only Product Line and Order Method. Automatic for Revenue. Average for Unit Sale Price.
D. Set the detail aggregation property to Default for product line and Order method. Default for Revenue and Average for Unit Sale Price.
Questions 5
A report author wants to create an Active Report with a chart that is dynamically rendered in the browser based on user selections.
How can this be accomplished?
A. A legacy chart with client side processing.
B. A legacy chart with server side processing.
C. A Virtualization with client side processing.
D. A Virtualization with server side processing.
Questions 6
An author wants to set a single value that will filter all other visualizations affected by its value.
Which visualization type should be used?
A. Summary
B. Tree map
C. Data player
D. Scatter plot
Questions 7
A report author wants to reduce the number of columns in a list by moving the related information into a single column.
What is the first action that needs to be performed?
A. Insert a block into the column header.
B. Right click the column header and unlock the cell.
C. Modify the column header properties and unlock it.
D. Click on the more button on the Application bar to unlock the report.
Questions 8
A report author would like to reuse a logo across all existing reports. Which object should be used?
A. Template
B. Bookmark
C. Global Class
D. Layout Component Reference
Questions 9
A customer has a bar chart in a report that displays a steady increase in revenue by product line over time. The requirement is to graphically illustrate this progression in the data series without significantly the report.
How can this be done?
A. Add a linear trendline to the chart.
B. Add a polynomial trendline to the chart.
C. Create and insert graphics to highlight the data points.
D. Hide data values within the chart and make the bars larger.
Questions 10
A report author needs the label in a List column title to be dynamic.
How can this be implemented with a dynamic value?
A. Pivot the List to a Crosstab.
B. Create a Master detail relationship to the data.
C. Unlock the report and insert a data item into the List column title.
D. Select the List column title and change the Source type to Data item label.
Questions 11
Which properties must be set when using a SQL object?
A. Data source and SQL
B. Package name and SQL
C. Cardinality and namespace
D. Primary Key and namespace
Questions 12
A report author was asked to create a report that displays Order method data within a List with a guide pointing to each Order method.
How can this be accomplished?
A. By creating a grouped list by Order method.
B. By creating data decks with lists filtering Order method.
C. By creating page breaks based on a data item and defining a grouping structure for the page set.
D. By adding a table of contents and a table of contents entry next to the order within the List.
Questions 13
A report author needs to create filters in Cognos Analytics ?Reporting.
What arte the three different types of filtering?
A. Required, Optional and Disabled
B. Detailed, Summary and Parameterized
C. Custom based in data item, Combined and Advanced
D. Before Auto-Aggregation, After Auto-Aggregation and with Scope
![]()
![]()
Home | About Us | Contact Us | FAQ | Guarantee Policy | Privacy Policy
Any charges made through this site will appear as Global Simulators Limited. All trademarks are the property of their respective owners.
Copyright © 2004-2026 pass2lead.com, All Rights Reserved.