

 Printable PDF

Splunk O11y Cloud Certified Metrics User: SPLK-4001
Want to pass your Splunk O11y Cloud Certified Metrics User SPLK-4001 exam in the very first attempt? Try Pass2lead! It is equally effective for both starters and IT professionals.
- Vendor: Splunk
- Exam Code: SPLK-4001
- Exam Name: Splunk O11y Cloud Certified Metrics User
- Certifications: Splunk Certifications
- Total Questions: 54 Q&As
- Updated on: Jul 03, 2026
- Note: Product instant download. Please sign in and click My account to download your product.


- Q&As Identical to the VCE Product
- Windows, Mac, Linux, Mobile Phone
- Printable PDF without Watermark
- Instant Download Access
- Download Free PDF Demo
- Includes 365 Days of Free Updates
VCE
- Q&As Identical to the PDF Product
- Windows Only
- Simulates a Real Exam Environment
- Review Test History and Performance
- Instant Download Access
- Includes 365 Days of Free Updates
Passing Certification Exams Made Easy
Everything you need prepare and quickly pass the tough certification exams the first time
- 99.5% pass rate
- 7 Years experience
- 7000+ IT Exam Q&As
- 70000+ satisfied customers
- 365 days Free Update
- 3 days of preparation before your test
- 100% Safe shopping experience
- 24/7 Support
Splunk SPLK-4001 Last Month Results
Free SPLK-4001 Exam Questions in PDF Format
Related Splunk Certifications Exams
SPLK-4001 Online Practice Questions and Answers
Questions 1
Given that the metric demo. trans. count is being sent at a 10 second native resolution, which of the following is an accurate description of the data markers displayed in the chart below?
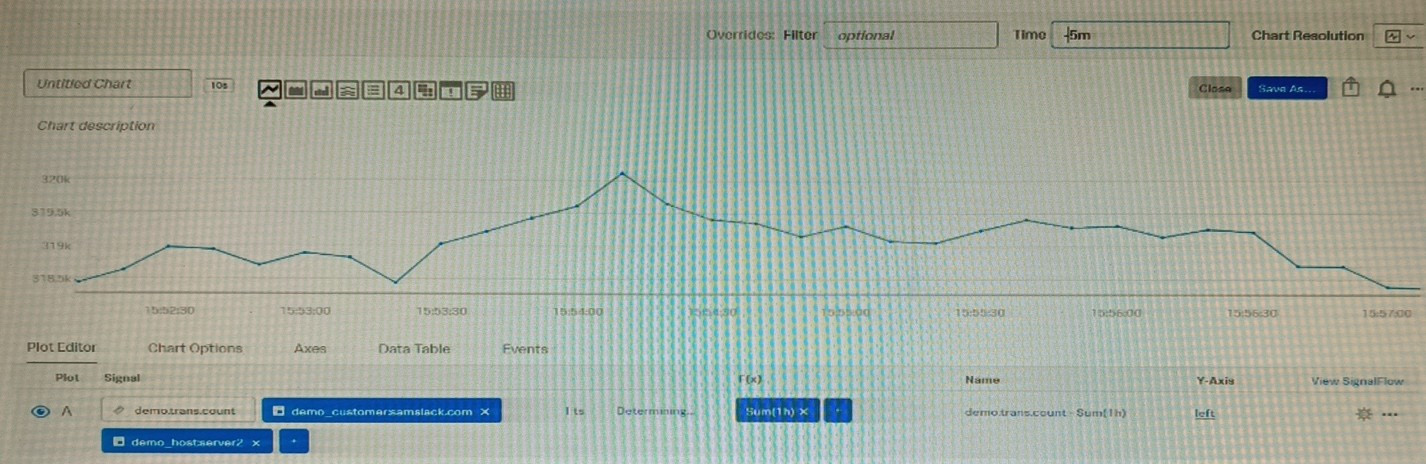
A. Each data marker represents the average hourly rate of API calls.
B. Each data marker represents the 10 second delta between counter values.
C. Each data marker represents the average of the sum of datapoints over the last minute, averaged over the hour.
D. Each data marker represents the sum of API calls in the hour leading up to the data marker.
Questions 2
A DevOps engineer wants to determine if the latency their application experiences is growing fester after a new software release a week ago. They have already created two plot lines, A and B, that represent the current latency and the latency a week ago, respectively. How can the engineer use these two plot lines to determine the rate of change in latency?
A. Create a temporary plot by dragging items A and B into the Analytics Explorer window.
B. Create a plot C using the formula (A-B) and add a scale:percent function to express the rate of change as a percentage.
C. Create a plot C using the formula (A/B-l) and add a scale: 100 function to express the rate of change as a percentage.
D. Create a temporary plot by clicking the Change% button in the upper-right corner of the plot showing lines A and B.
Questions 3
Which component of the OpenTelemetry Collector allows for the modification of metadata?
A. Processors
B. Pipelines
C. Exporters
D. Receivers
Reviews
-
souam
 MoroccoThere are many new questions in the dumps and the answers are accurate and correct. I finished my exam with high score this morning, thanks very much.
 -
Adair
 Turkeywhen i seat for exam, i found that some answers are in different order in the real exam.so you can trust this dumps.
 -
YIYI
 Indiatoday all the question are from this dumps, so i passed the exam without doubt. thanks for it. Recommend.
 -
Branden
 Sri LankaI passed. Good luck to you.
 -
Olsen
 United StatesOne of my friends told me that your dumps are good and I purchased it. Great. I passed my exam with it. Nice work, guys.
 -
Butt
 PolandAbsolutely valid. i passed today. You are the best. Thanks so much.
 -
Cadman
 GreeceI'm feeling luck because there are no new questions! All the questions are form this dumps!!! Thanks for your help! Thank you all !!!
 -
Rainer
United Statesvalid just passed my exam with this dumps. SOme answers are incorrect. but so far so good. thanks -
Isaiah
 KazakhstanVery effective study material.I just passed my exam. As long as you studied this material careful, you will pass the exam with high score. Recommend.
 -
Talon
United StatesStill valid!! 97%
![]()
![]()
Home | About Us | Contact Us | FAQ | Guarantee Policy | Privacy Policy
Any charges made through this site will appear as Global Simulators Limited. All trademarks are the property of their respective owners.
Copyright © 2004-2026 pass2lead.com, All Rights Reserved.