
TDA-C01 Online Practice Questions and Answers
Questions 4
You have the following dataset.

Which Level of Detail (LOD) expression should you use to calculate tie grand total of all the regions?
A. {FIXED: [Region] SUM Sales}
B. {FIXED: SUM Sales}
C. {Fixed: [Region]: TOTAL Sales}
D. {FIXED: TOTAL (Sales)}
Questions 5
You have the Mowing dashboard.
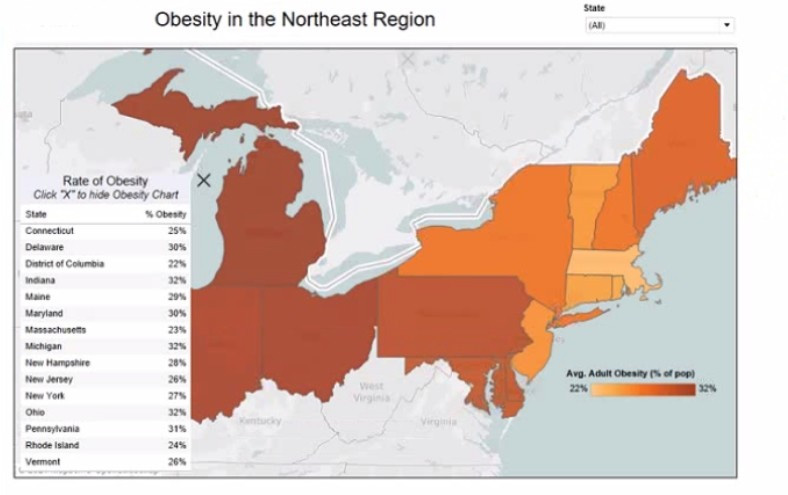
Which two elements are floating? Choose two.
A. The state filter
B. The color legend C. The map
D. The Rate of Obesity chart
E. The little
Questions 6
You have the following line chart that shows the average sales by month.
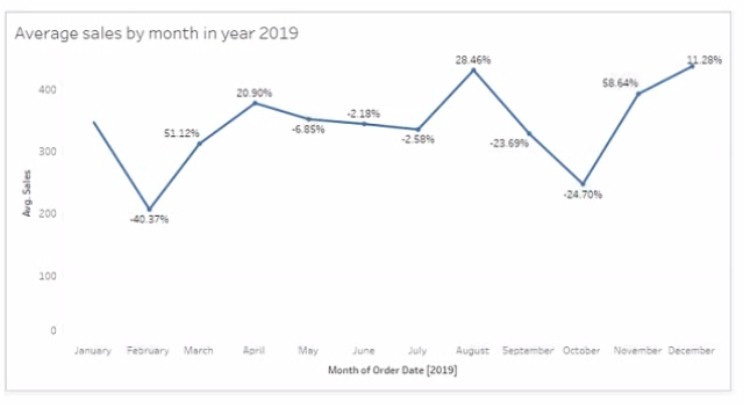
Which month had the biggest increase in swage sales compared to me previous month in 2019?
A. August
B. October
C. December
D. November
Questions 7
You have the following bar chart.
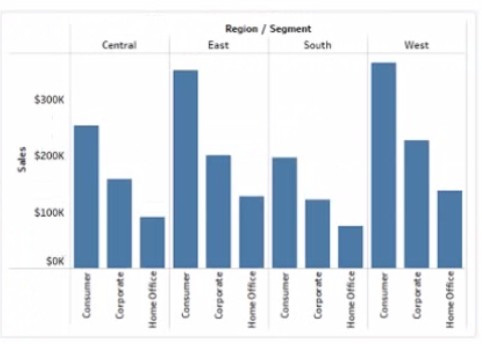
You want the chart to appear as shown in the Mowing exhibit.
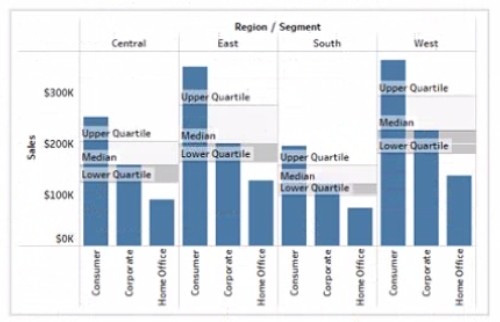
What should you add?
A. A reference band
B. A reference line
C. An average line
D. A distribution band
Questions 8
You have the following dataset.
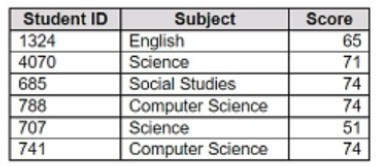
You want to create a new calculated dimension field named Category that meets the following conditions:
When Subject is Computer Science or Science, Category must be Sciences. When Subject is English or Social Studies, Category must be Humanities.
Which two logical functions achieve the goal? Choose two.
A. IF [Subject]- 'Science' THEN 'Sciences' ELSEIF [Subject]='English' THEN 'Humanities' ELSEIF [Subject]-'Social Studies' THEN 'Humanities' ELSEIF [Subject]= 'Computer Science' THEN 'Sciences' END
B. IIF(( CONTAINS ([Subject], 'Science') = TRUE) , 'Humanities', 'Sciences')
C. IF ENDSWITH ( [Subject], 'Computer Science') THEN 'Sciences' ELSE 'Humanities' END
D. CASE [Subject] WHEN 'Computer Science' THEN 'Sciences' WHEN 'Science' THEN 'Sciences' WHEN 'English' THEN 'Humanities' WHEN 'Social Studies' THEN 'Humanities' End
Questions 9
You have a data source that contains 20 tables.
You want the tables to be organized within the Data pane based on the type of data contained within the tables.
What should you use?
A. Folders
B. Hierarchies
C. Sets
D. Groups
Questions 10
You have the following Map.
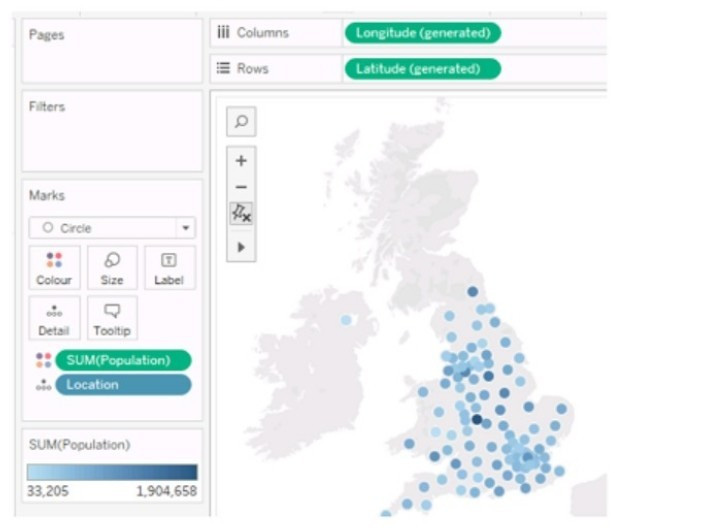
You need the map to appear as shown in the following visualization.
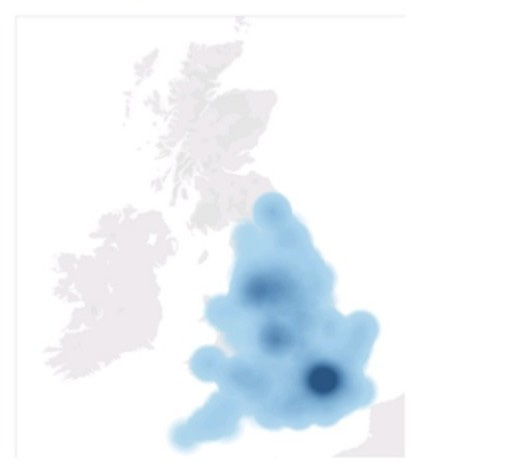
What should you do?
A. Drag Location to Size on the Marks card.
B. Change the opacity to 75%.
C. Drag Population to Size on the Marks card.
D. Change the mark type to Density.
E. Change the mark type to Map.
Questions 11
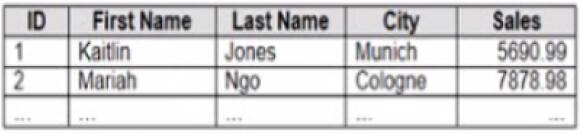
You company has two divisions located in the United States and Germany Bach division has a separate database. The following is a sample of the sales data for the division in the United States.
The following is a sample of the sales data for me division in Germany.
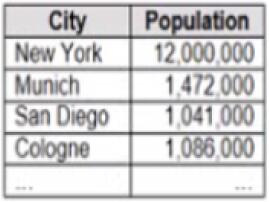
You have population data in a file named Populatio.csv. the following is a sample of the data.
You plan to create a visualization that ml show tie sales per capita for each salesperson Each salesperson must be identified by identified by their full name.
You need to prepare the data to support the planned visualization. The data source must support being published .
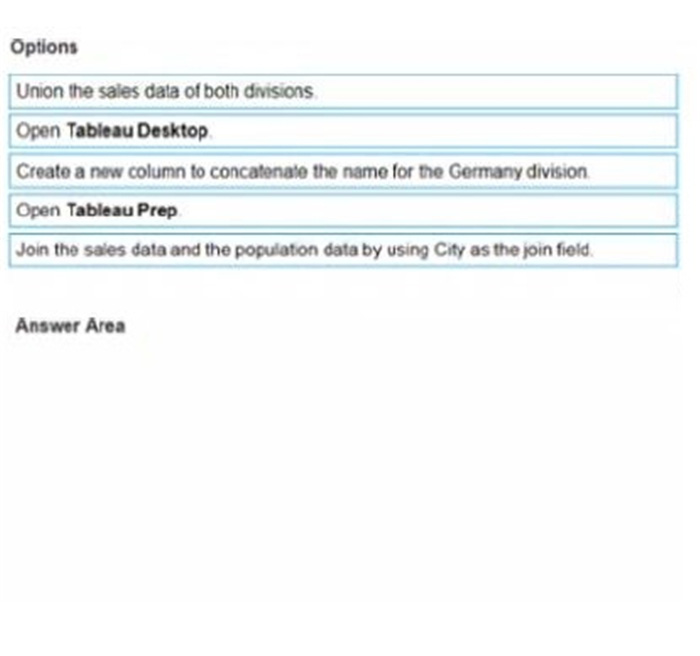
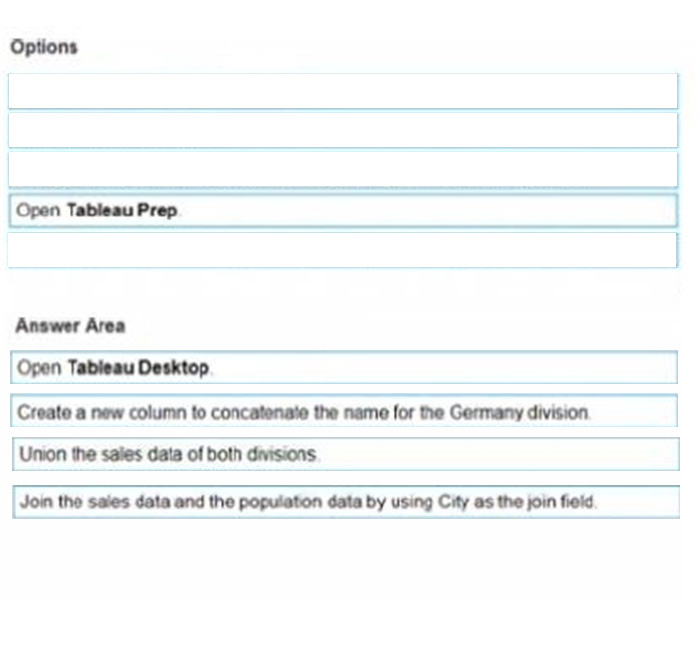
Which four actions should you perform in order?
(Place the four correct options n order Use the arrows to move Options to Answer Area arrows to re-order the options. Use Answer Area arrows to re-order the options)
Select and Place:
Questions 12
You have the following dashboard.
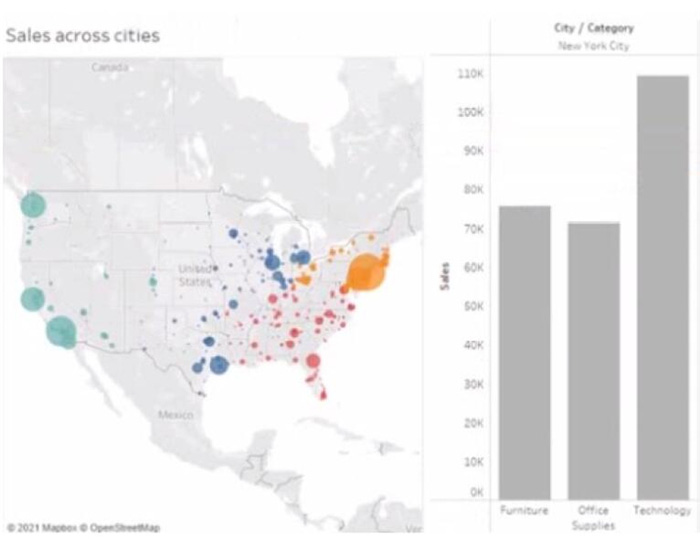
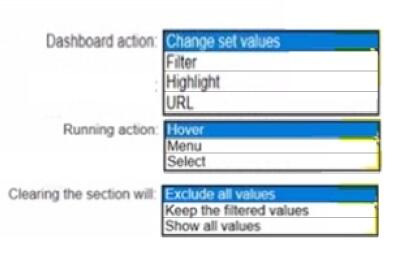
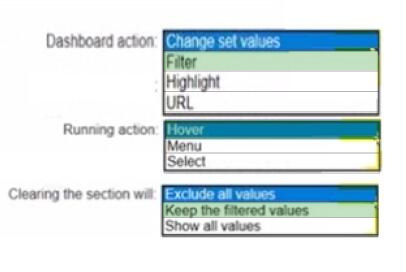
When a user selects a only on the map the data on the bar chart must show only the data for the selected city. The data in the bar chart must change only when the user selects a different city How should you configure the dashboard action? (Use the dropdowns in the Answers Area to select the correct options.)
Hot Area:
Questions 13
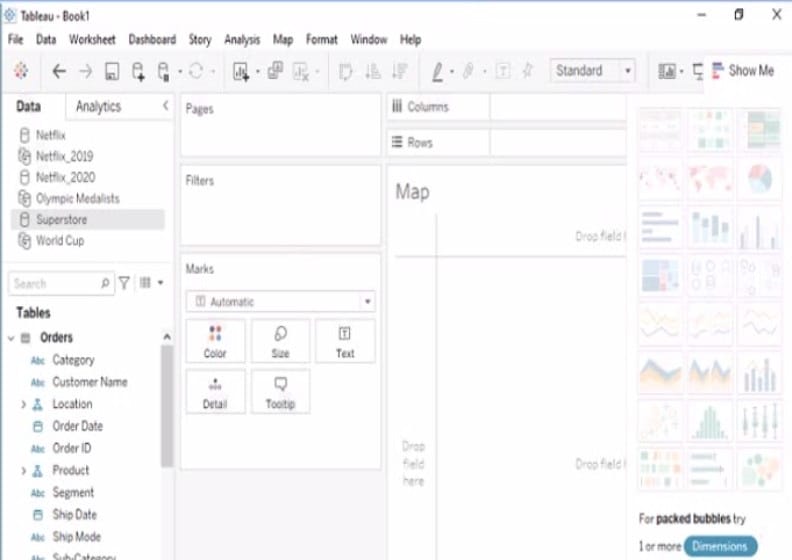
HOTSPOT
You have a dashboard that is configured for desktop browsers.
You want to customize a layout for mobile users.
Which option should you select first? (Click the appropriate Option in the Answer Area.)
Hot Area:


![]()
![]()
Home | About Us | Contact Us | FAQ | Guarantee Policy | Privacy Policy
Any charges made through this site will appear as Global Simulators Limited. All trademarks are the property of their respective owners.
Copyright © 2004-2026 pass2lead.com, All Rights Reserved.